Quick Comparison
# | Method | Best for | Effort | Gives you |
|---|
1 | Forecast before you start | Getting budget approved | Low | A number to be judged against |
2 | Business KPI tracking | Most programmes | Low | Real business movement |
3 | Kirkpatrick four levels | A structured baseline | Medium | A clear framework |
4 | Triangulated attribution | When no control group is possible | Medium | A defensible percentage |
5 | Retention comparison | Leadership programmes | Medium | A cost saving in money |
6 | Phillips ROI formula | CFO conversations | High | A percentage return |
7 | Control group | High value programmes | High | The strongest proof |
1. Forecast ROI Before the Programme Starts
Most people think of measurement as something you do after training. That is backwards, and it is why so much measurement fails. The strongest thing you can do costs one afternoon and happens before anything is booked.
What it is
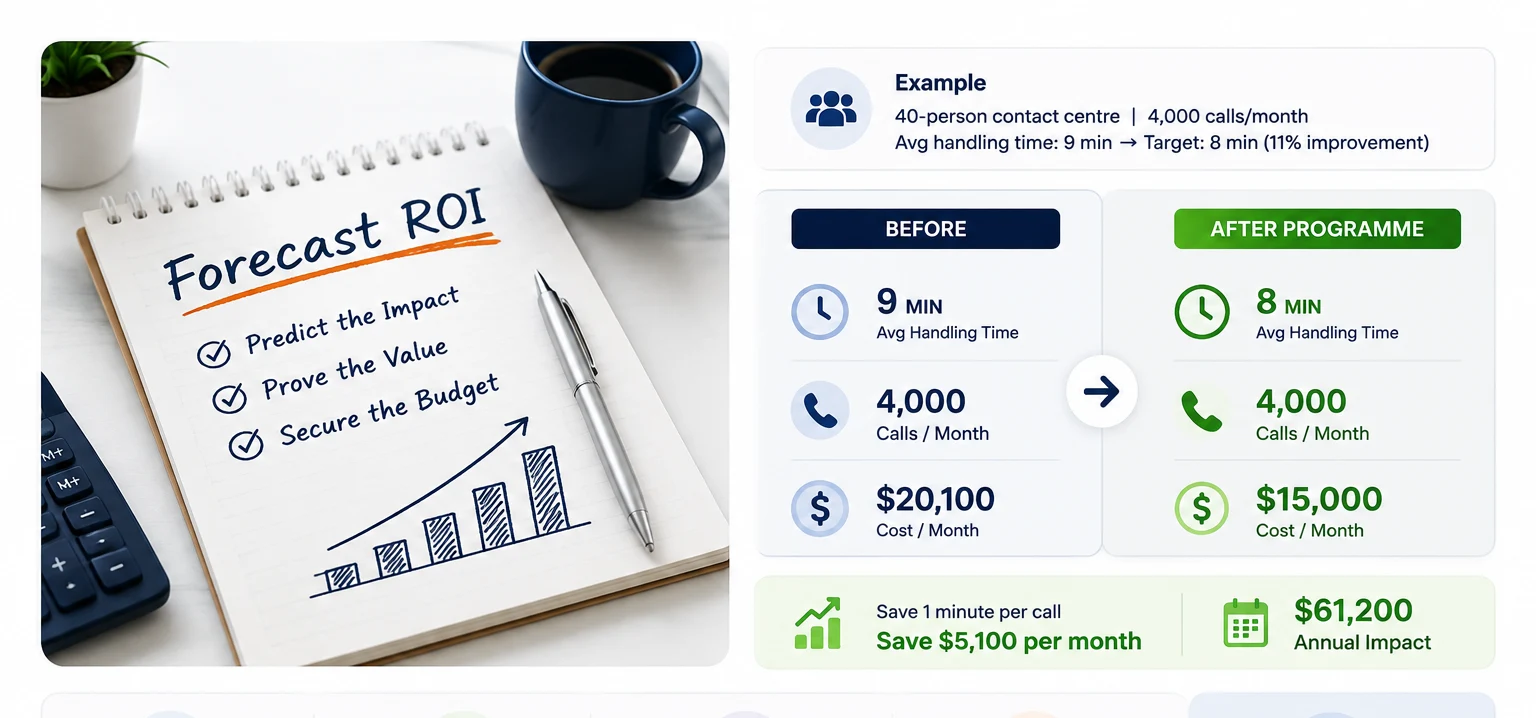
Instead of measuring after, you model the expected return before you ask for budget. You pick the number you expect to move, estimate how much it will move, put a money value on that movement, and compare it to what the programme costs.
What it looks like in practice
Say you are running a service programme for a 40 person contact centre. Your average handling time is 9 minutes. You expect the programme to bring it to 8 minutes, which is about 11 percent. Your team handles 4,000 calls a month. One minute saved per call is roughly 67 hours of staff time a month. At an average loaded cost of 25 dollars an hour, that is about 1,675 dollars a month, or 20,100 a year. The programme costs 15,000 dollars including participant time. You now walk into the budget meeting with a forecast instead of a hope. And you have written down that 9 minutes is where you started, which is the part that makes everything else possible later.
Why this changes the conversation
Leadership is not usually against training. They are against spending on something with no visible outcome. A forecast turns an expense into a proposal. It also protects you. If you said 11 percent and delivered 9 percent, that is a good result you can defend. If you said nothing and delivered 9 percent, you have nothing to point at.
What to watch out for
Do not be optimistic. Pick a number you are confident about beating. The temptation is to forecast something impressive to get the budget approved. Resist it. A forecast you exceed builds trust for the next request. A forecast you miss makes the next request harder, even if the programme genuinely worked.
2. Track a Business KPI the Company Already Watches
This is the cheapest ongoing method, and for most programmes it is the only one you actually need.
What it is
Pick one number the business already tracks and already cares about. Record where it stands before the programme. Check it again after. That is the whole method.
Choosing the right number
The number should be close enough to the training that the connection is obvious to anyone.
Programme | Good number to track | Bad number to track |
|---|
Customer service training | Complaints per 1,000 customers | Overall revenue |
Sales methodology training | Win rate on qualified deals | Total company profit |
Manager training | Turnover in that manager's team | Employee satisfaction overall |
Negotiation training | Average discount given | Market share |
The left column moves because of the training. The right column moves because of a hundred things, and the moment you claim credit for it, someone in the room will point that out.
Why it works better than a custom metric
You are not asking leadership to accept a new measurement. They already look at this number every month, they already trust it, and they already know what good looks like. That saves you an entire argument. Instead of defending your metric, you are just showing movement in theirs.
What to watch out for
Set the baseline before the programme, not after. This sounds obvious and it is the single most common failure in training measurement. Also record what else was happening. If you ran the training during a quiet quarter, or right after a new system went live, note it. Someone will ask, and having the answer ready is better than being caught out.
3. The Kirkpatrick Four Levels
This is the oldest and most widely used training evaluation framework. It is worth knowing properly, because most organisations use the name while only doing a quarter of the work.
The four levels
Level | What it measures | How you measure it | When |
|---|
1. Reaction | Did they like it | Post-session survey | Same day |
2. Learning | Did they learn anything | Test before and after | Same week |
3. Behaviour | Are they working differently | Manager observation, self report | 60 to 90 days |
4. Results | Did the business change | Business KPIs | 3 to 6 months |
Where most organisations stop
At Level 2. They run a happy sheet, maybe a quiz, and file the results. That tells you people enjoyed a session and remembered some content on the day. It tells you nothing about whether anyone works differently now, which is the only reason you paid for the training.
Real evidence begins at Level 3.
Making Level 3 actually work
Level 3 fails when it becomes a form-filling exercise. Managers get asked to rate whether their team member has improved, they tick the middle box, and everyone moves on. It works when managers know beforehand what to look for. Give them three specific things to watch for during the 90 days, in plain language.
For a service programme that might be: does this person now acknowledge the issue before offering a fix, do they explain what happens next without being asked, and do they check the customer is satisfied before closing.
Three specific behaviours. Not a rating scale.
What to watch out for
Do not skip Level 1 and 2 entirely just because they are weak on their own. They are cheap, and they help you diagnose. If people learned nothing at Level 2, you know the problem is the content. If they learned it but Level 3 shows no change, the problem is back at work, not in the room.
4. Triangulated Attribution
Here is the hardest question in training measurement. The number moved. How much of that was the training, and how much was everything else? There is no perfect answer. This method gets you a defensible one.
What it is
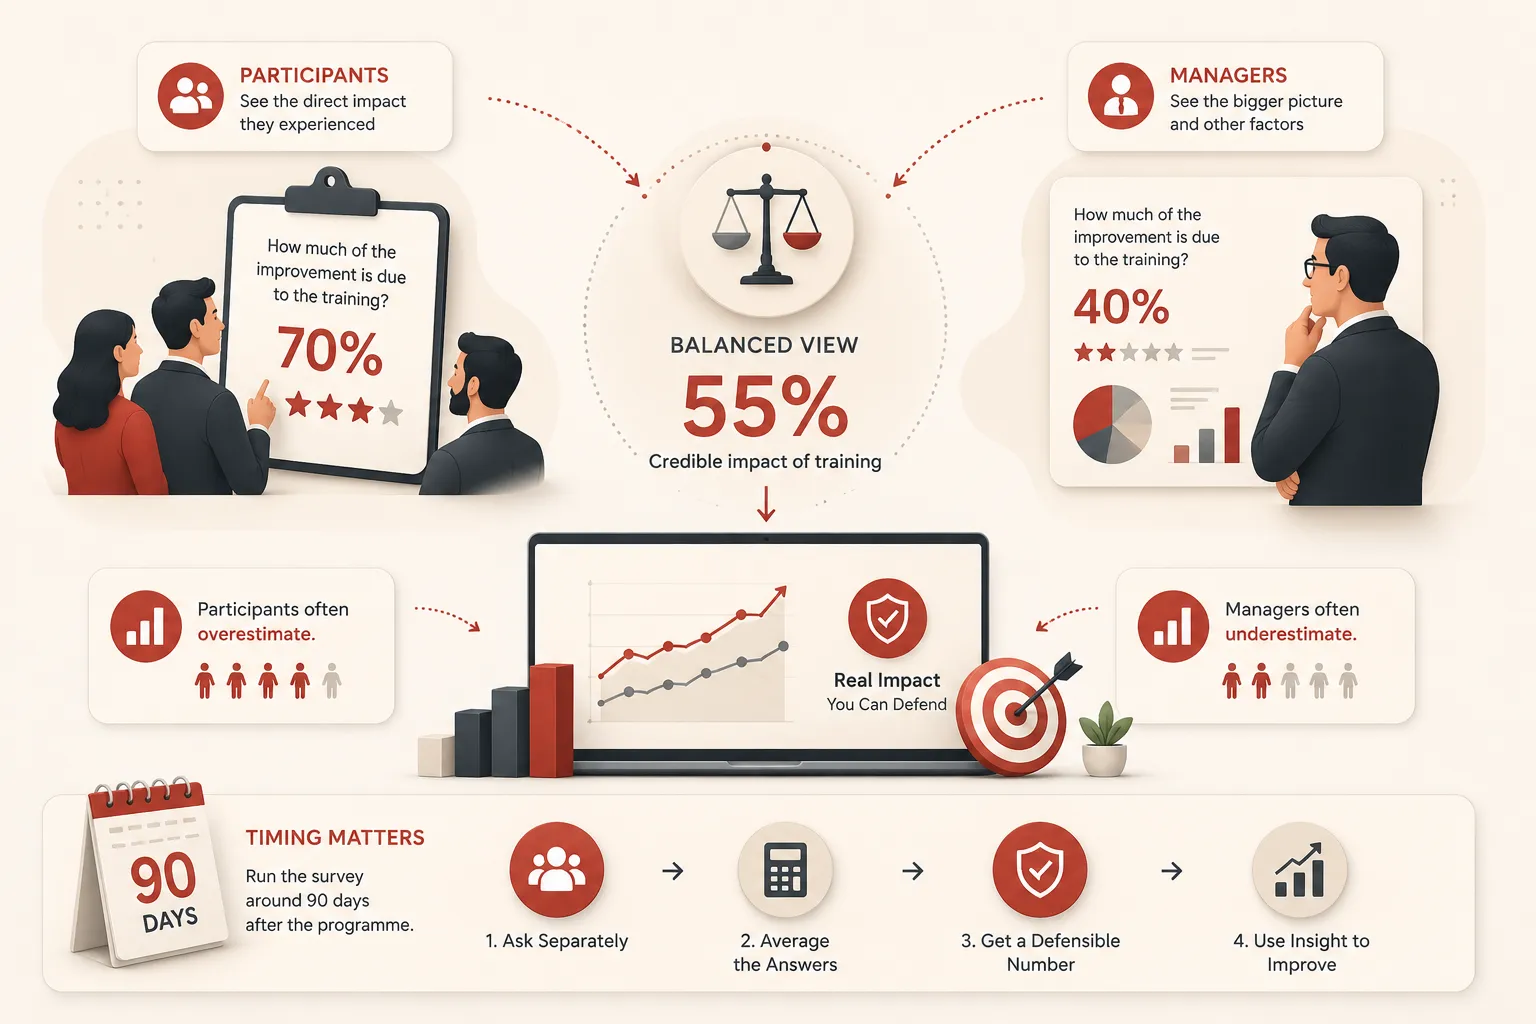
Ask two groups the same question, separately, then average their answers. Ask participants: of the improvement you have seen in this area, what percentage do you credit to the training? Then ask their managers, independently, the same question about the same people.
Why averaging works
Participants tend to overstate. They invested time and want it to have mattered. Managers tend to understate. They see other factors, including their own coaching, and they were not in the room. The two biases pull in opposite directions. Averaging them lands closer to reality than either one alone, and more importantly, it is a method you can explain in a meeting without anyone accusing you of picking a convenient number.
A worked example
Complaints dropped from 120 a month to 90. That is 30 fewer complaints. Participants say 70 percent of that was the training. Managers say 40 percent. The average is 55 percent. So you claim credit for roughly 16 of the 30 complaints, not all 30. Claiming 16 makes you credible. Claiming 30 makes everything else you say suspect.
What to watch out for
Timing. Run this around 90 days after the programme. Any earlier and behaviour has not settled. Any later and memory has faded to the point where the answers are guesses. Also keep the two surveys genuinely separate. If managers and participants discuss it first, you get one answer twice, not two independent ones.
5. Compare Retention Between Trained and Untrained Staff
This is the method most L&D teams overlook, and in a tight labour market it is often the strongest argument available.
What it is
Compare how long people stay, between those who completed a programme and similar colleagues who did not.
Why it is powerful
Turnover already has a money value attached, and finance usually already knows it. Recruitment fees, notice periods, onboarding time, and the months of reduced productivity while a new person learns the job.
That means you do not have to convince anyone the saving is real. You just have to show the difference in turnover and multiply.
A worked example
Twenty five managers completed a leadership programme. Over the following year, two left. That is 8 percent. Across comparable managers who did not attend, turnover was 20 percent. That is a 12 percentage point difference, which is roughly three people who stayed and might otherwise have gone. If your organisation costs replacement at 50,000 dollars per manager, that is 150,000 dollars of avoided cost against a programme that might have cost 40,000.
What to watch out for
Compare like with like. If the trained group were high performers hand-picked for development, they were probably more likely to stay anyway. Match on role, seniority and tenure as closely as you can, and say openly where the match is imperfect.
Being upfront about the limitation is what makes the rest of the number believable.
This is the one that produces the percentage a CFO recognises. It builds on Kirkpatrick by adding a fifth level that converts business results into money.
The formula
ROI = ((Benefits minus Costs) divided by Costs) times 100
Counting the costs honestly
This is where most calculations fall apart. Costs are not just the invoice. Include the programme fee, participant time at their loaded hourly cost, facilitator time if internal, travel and venue, materials and platform costs, and the cost of doing the measurement itself. Participant time is usually the biggest line and the one people leave out. Twenty people for two days is 320 hours. At 40 dollars an hour that is 12,800 dollars, which may well exceed the programme fee. Leave it out and a CFO will find it. Include it and you look like someone who understands the business.
A worked example
Using the retention numbers above: benefits of 150,000, costs of 40,000. 150,000 minus 40,000 is 110,000. Divided by 40,000 is 2.75. Times 100 is 275 percent. But apply the attribution percentage from method 4 first. If attribution is 55 percent, your benefit is 82,500 rather than 150,000. 82,500 minus 40,000 is 42,500. Divided by 40,000 is 1.06. Times 100 is 106 percent. A defensible 106 percent beats an inflated 275 percent every time.
What good looks like
Published benchmarks generally place a healthy training ROI between 25 and 300 percent, meaning roughly 1.25 to 4 dollars back for every dollar spent. If your number lands far above that range, something in the calculation is too generous, and the meeting will not go the way you hope.
What to watch out for
Do not run this on every programme. It takes real work and it needs Level 4 results plus an attribution figure. Save it for the programmes big enough to justify the effort, or for the one you know you will be asked to defend.
7. The Control Group
The strongest proof available, and the hardest to arrange.
What it is
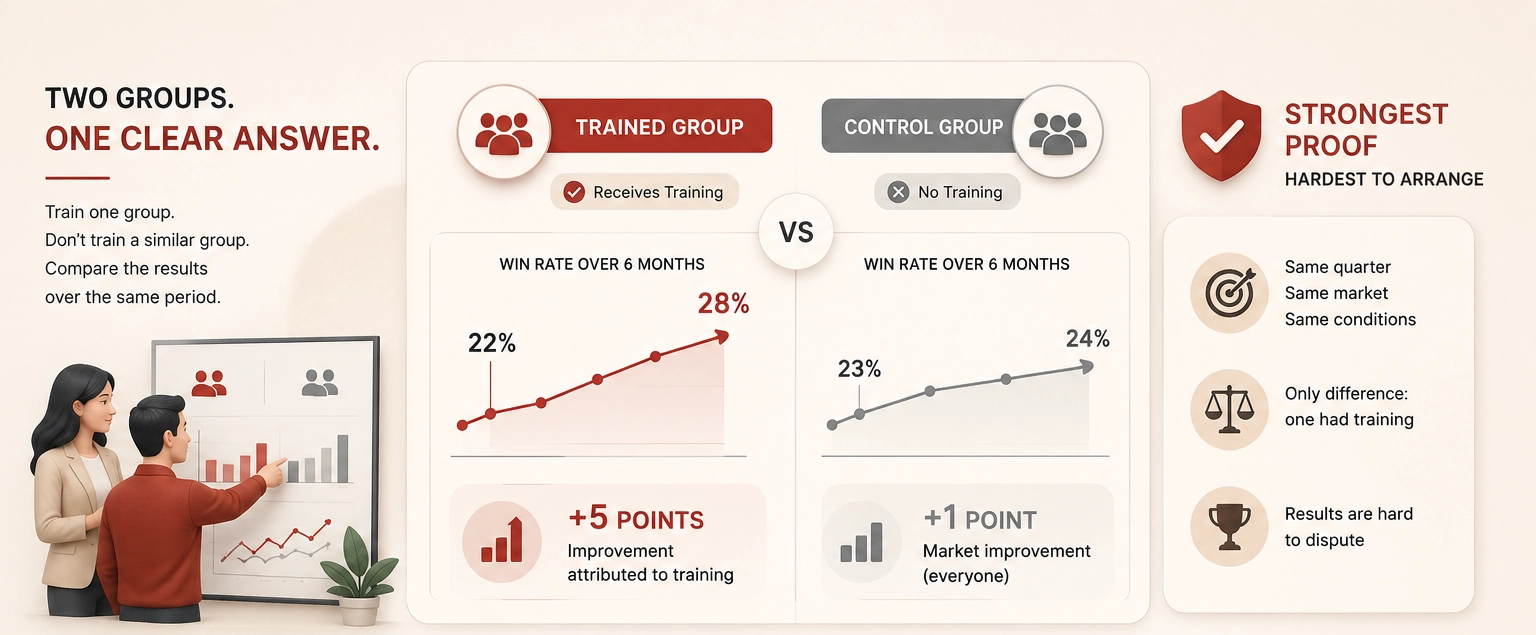
Train one group. Do not train a similar group. Compare the two over the same period.
Why it settles the argument
Every other method leaves room for the same objection: how do you know it was the training and not the market, the new system, or the season?A control group answers it. Both groups faced the same quarter, the same market and the same conditions. Only one had the training. If only one improved, the case is hard to dispute.
A worked example
Two sales regions of similar size and maturity. Region A gets the programme in January. Region B does not. Over six months, Region A's win rate goes from 22 percent to 28 percent. Region B goes from 23 percent to 24 percent. The market moved everyone by about one point. The training accounts for the other five. No attribution survey needed. The comparison does the work.
Making it politically workable
Somebody has to be told they are not getting the training yet, and that can create resentment if handled badly. Frame it as a phased rollout, which is usually what it genuinely is. Region B goes second, in the next cycle. Tell them that clearly and give them a date. Most organisations run phased rollouts anyway for budget reasons. The only extra step is deciding to measure the gap between the phases.
What to watch out for
The groups have to be genuinely comparable. Different markets, different managers or different product mixes will produce a difference that has nothing to do with training, and someone will spot it.